
Josh Aharonoff
Jun 8, 2023
Welcome to an information-packed edition of Legit Numbers!
Brace yourself for a dashboard extravaganza as I unveil 7 incredible chart templates fused into one comprehensive dashboard. I'll also delve into the significance of Inventory Accounting and explore the essential Startup KPIs.
What we’ll be covering in this edition:
7 Chart Templates…wrapped into one Dashboard
Learn about Inventory & Accounting
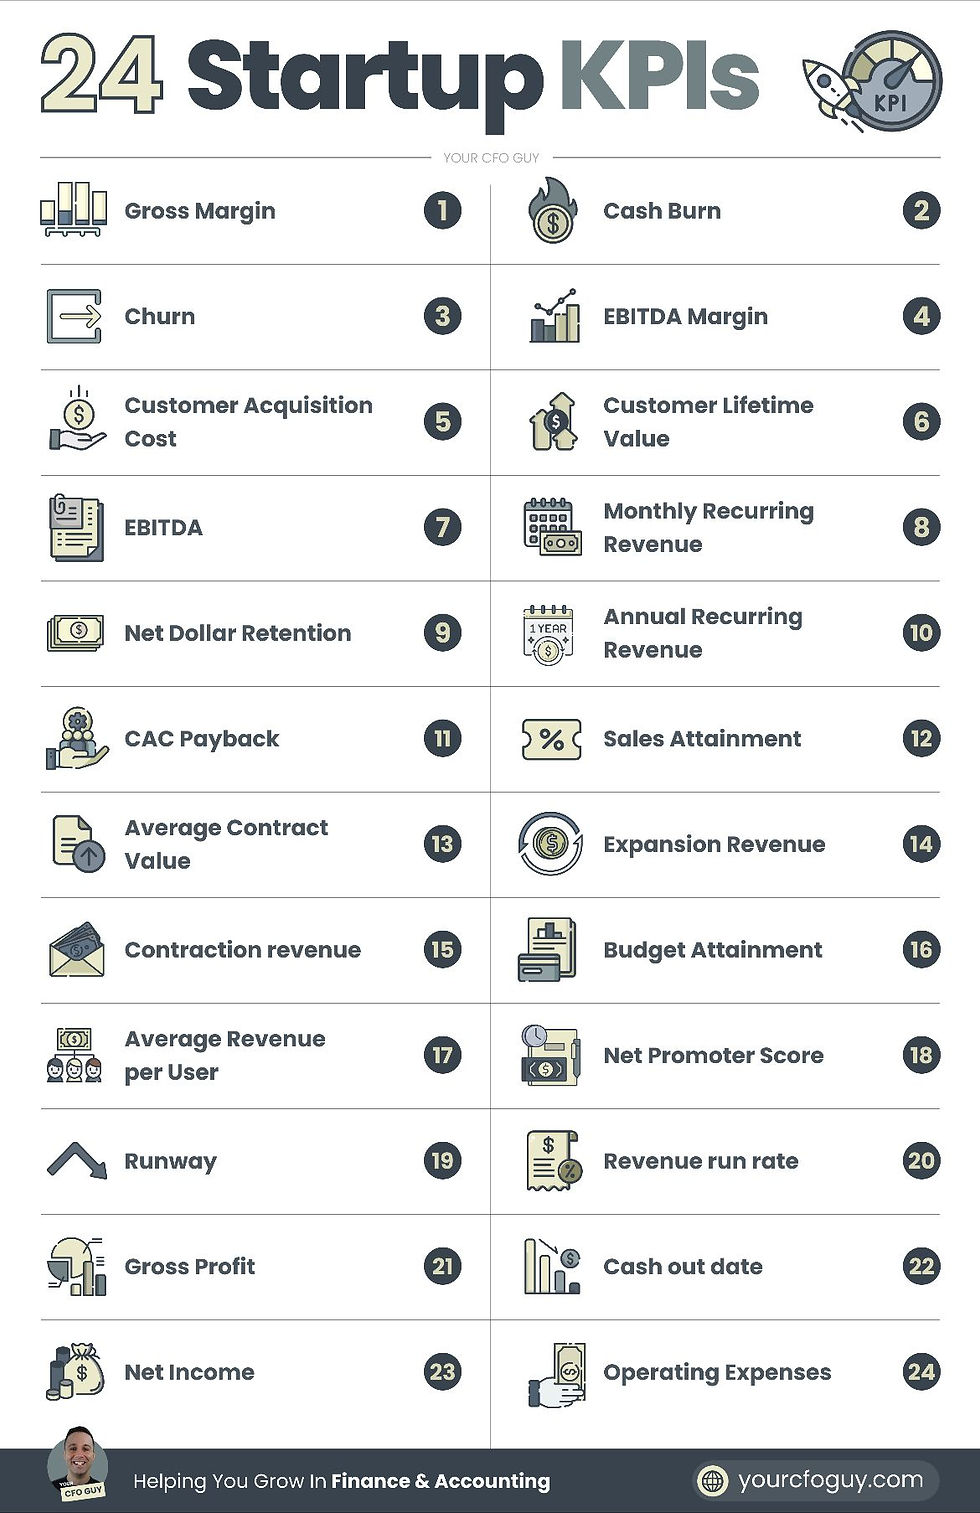
24 Startup KPIs
Let’s get started
This Dashboards contains some of my favorite methods for presenting financial data in excel
Let’s dive into each concept:
1️⃣ The Donut
This is great for displaying a % of something - you may recognize the style from your your apple watch on the battery meter
My favorite use for this chart is with a budget vs actuals (ex: 80% hit on revenue target)
2️⃣ The Pie Chart
This is best for showcasing the split between different categories
In this example, I chose to split opex by category
3️⃣ The Bar Chart
Bar Charts help you showcase data across a timeline
In this example, we are showcasing ending cash
4️⃣ The Line Chart
Line charts are similar to bar charts in that they help you showcase information across a time period
I am extra fan of line charts when you have multiple series, and you want to show them intersect
In this example, we showcase the breakeven point, when profits intersect with costs
5️⃣ The Combo Chart
This chart is a combination of charts 2 and 3, and is great to showcase 2 different series, ideally on a different axis (ex: Revenue on one axis, gross margin on another)
6️⃣ The KPI
This one is entirely custom, and is one of my favorite ways of conveying financial data
In this case, we’re showcasing our performance on various KPIs, compared to last year
7️⃣ The Table
This may be the most common method of showcasing data - but it doesn’t have to be boring!
Common uses are a summarized P&L, Balance Sheet, or Cash Flows
What are some other ways that you prsent financial data?
Get the 7 Chart Templates from my website by clicking the image below

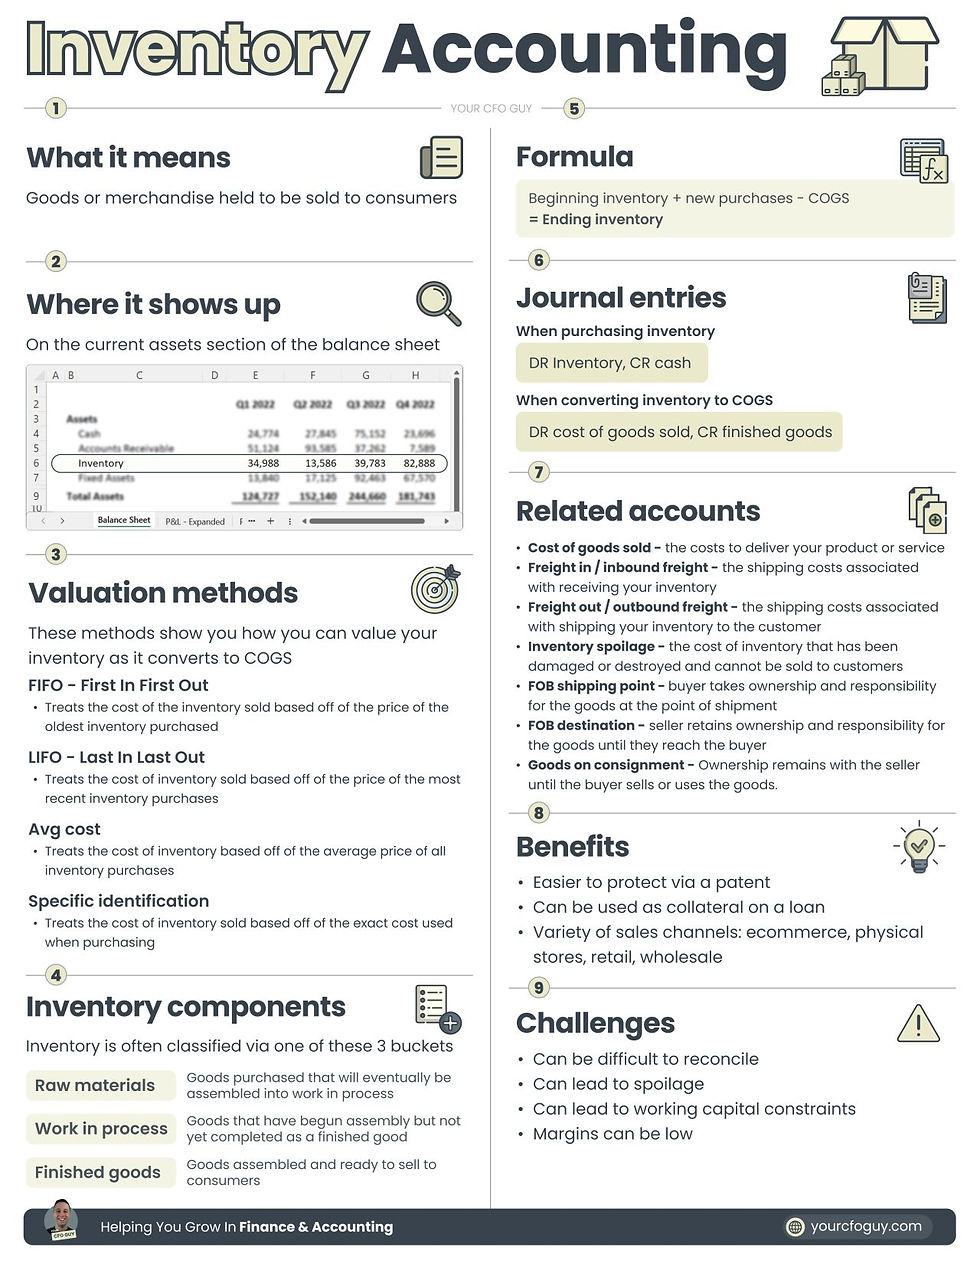
➡️ What it means → goods that will be converted into finished products to be sold to consumers
➡️ Where it shows up → on the current assets section of the balance sheet
➡️ Valuation methods → these methods show you how you can value your inventory as it converts to COGS
1️⃣ FIFO - First In First Out
Treats the cost of the inventory sold based off of the price of the oldest inventory purchased
2️⃣ LIFO - Last In First Out *(infographic has a typo)
Treats the cost of inventory sold based off of the price of the most recent inventory purchases
3️⃣ Avg cost
Treats the cost of inventory based off of the average price of all inventory purchases
4️⃣ Specific identification
Treats the cost of inventory sold based off of the exact cost used when purchasing
➡️ Inventory components - inventory is often classified via one of these 3 buckets
1️⃣ Raw materials - goods purchased that will eventually be assembled into finished goods
2️⃣ Work in process - goods that have begun assembly but not yet completed as a finished good
3️⃣ Finished goods - goods assembled and ready to sell to consumers
➡️ Formula
Beginning inventory
+ new purchases
- COGS
=ending inventory
➡️ Journal entries
1️⃣ When purchasing inventory → DR Inventory, CR cash
2️⃣ When converting inventory to COGS → DR cost of goods sold, CR finished goods
➡️ Related accounts
▪️ Cost of goods sold - the costs to deliver your product or service
▪️ Freight in / inbound freight - the shipping costs associated with receiving your inventory
▪️ Freight out / outbound freight - the shipping costs associated with shipping your inventory to the customer
▪️ Inventory spoilage - the cost of inventory that has been damaged or destroyed and cannot be sold to customers
▪️ FOB shipping point - buyer takes ownership and responsibility for the goods at the point of shipment
▪️ FOB destination - seller retains ownership and responsibility for the goods until they reach the buyer
▪️ Goods on consignment - Ownership remains with the seller until the buyer sells or uses the goods.
➡️ Benefits
👍 Easier to protect via a patent
👍 Can be used as collateral on a loan
👍 Variety of sales channels: ecommerce, physical stores, retail, wholesale
➡️ Challenges
😕 Can be difficult to reconcile
😕 Can lead to spoilage
😕 Can lead to working capital constraints
😕 Margins can be low
That’s my take on inventory - what would you add?
Gross Margin → Gross Profit / Revenue
Cash Burn → Cash consumed, not factoring in financing activities
Churn → Lost revenue / customers who are no longer active
EBITDA Margin → EBITDA / Revenue
Customer Acquisition Cost → Cost to acquire a customer
Customer Lifetime Value → Total expected revenue from a customer over their lifetime
EBITDA → Net Income + Interest + Taxes + Depreciation + Amortization
Monthly Recurring Revenue → Revenue from customers subscribed to monthly recurring plans
Net Dollar Retention → Net revenue / opening MRR
Annual Recurring Revenue → Revenue from customers subscribed to Annual recurring plans
CAC Payback → Period of time till you make back your Customer Acquisition Cost
Sales Attainment → % of quota attained by sales team
Average Contract Value → Total Revenue / # of Contracts (B2B)
Expansion Revenue → Added Revenue from recurring customers
Contraction revenue → Reduced revenue from recurring customers
Budget Attainment → % of your budget achieved
Average Revenue per User →Total Revenue / # of Users (B2C)
Net Promoter Score → Used to measure customer loyalty based off of likelihood to refer
Runway → How many months till you run out of cash
Revenue run rate → This months revenue * 12
Gross Profit → Revenue - COGS
Cash out date → Date in which you run out of cash
Net Income → Revenue - COGS - Operating Expenses + Other Income - Other Expenses
Operating Expenses → Company Expenses not related to your Cost of Goods Sold, or Other Expenses
Did I miss any?
And that concludes another enlightening edition of Legit Numbers.
I hope you found valuable insights in this week's digest on chart templates, Inventory Accounting, and Startup KPIs.
Stay tuned for more exciting content in the weeks to come.
Until next time, keep mastering Finance & Accounting!